Welcome back! If you haven’t already, make sure to check out Part 1 of Understanding Instagram Insights (link to part 1 here)! In this blog, we have Simplified how to track the performance of some of the latest Instagram features such as Instagram Stories, IGTV, and Instagram shopping. Let’s get started!
Part 1: Instagram Stories
500 million people use Instagram Stories every day because they are a great way to constantly be in touch with your followers. In fact, Instagram continues updating the Story feature to incorporate fun, interactive elements such as GIFs, Polls, Filters, Stickers, and Questions.
Just like the Instagram Post Insights, you can discover Stories Analytics through the Insights tab or by swiping up on an Instagram Story.

Source: Original
For an overview of how your stories are performing, tap the “Content You Shared” tab under Insights and sort up to 30 days of stories based on metrics such as:
- Back
- Call Button Taps
- Email Button Taps
- Exited
- Follows
- Next Story
- Get Directions Taps
- Impressions
- Link Clicks
For a detailed overview, you can swipe up on an Instagram Story and see the following details:
- Profile Visits: How many people went and viewed your profile.
- Reach: Number of unique accounts that have seen your Story.
- Impressions: Number of times your Story has been seen.
- Replies: Number of Replies to a Story.
- Back: Number of users that went back from this story post.
- Forward: Number of users that skipped this Story.
- Exited: Number of times a user swiped away from a specific story.
- Next Story: Number of taps to the next account’s story.
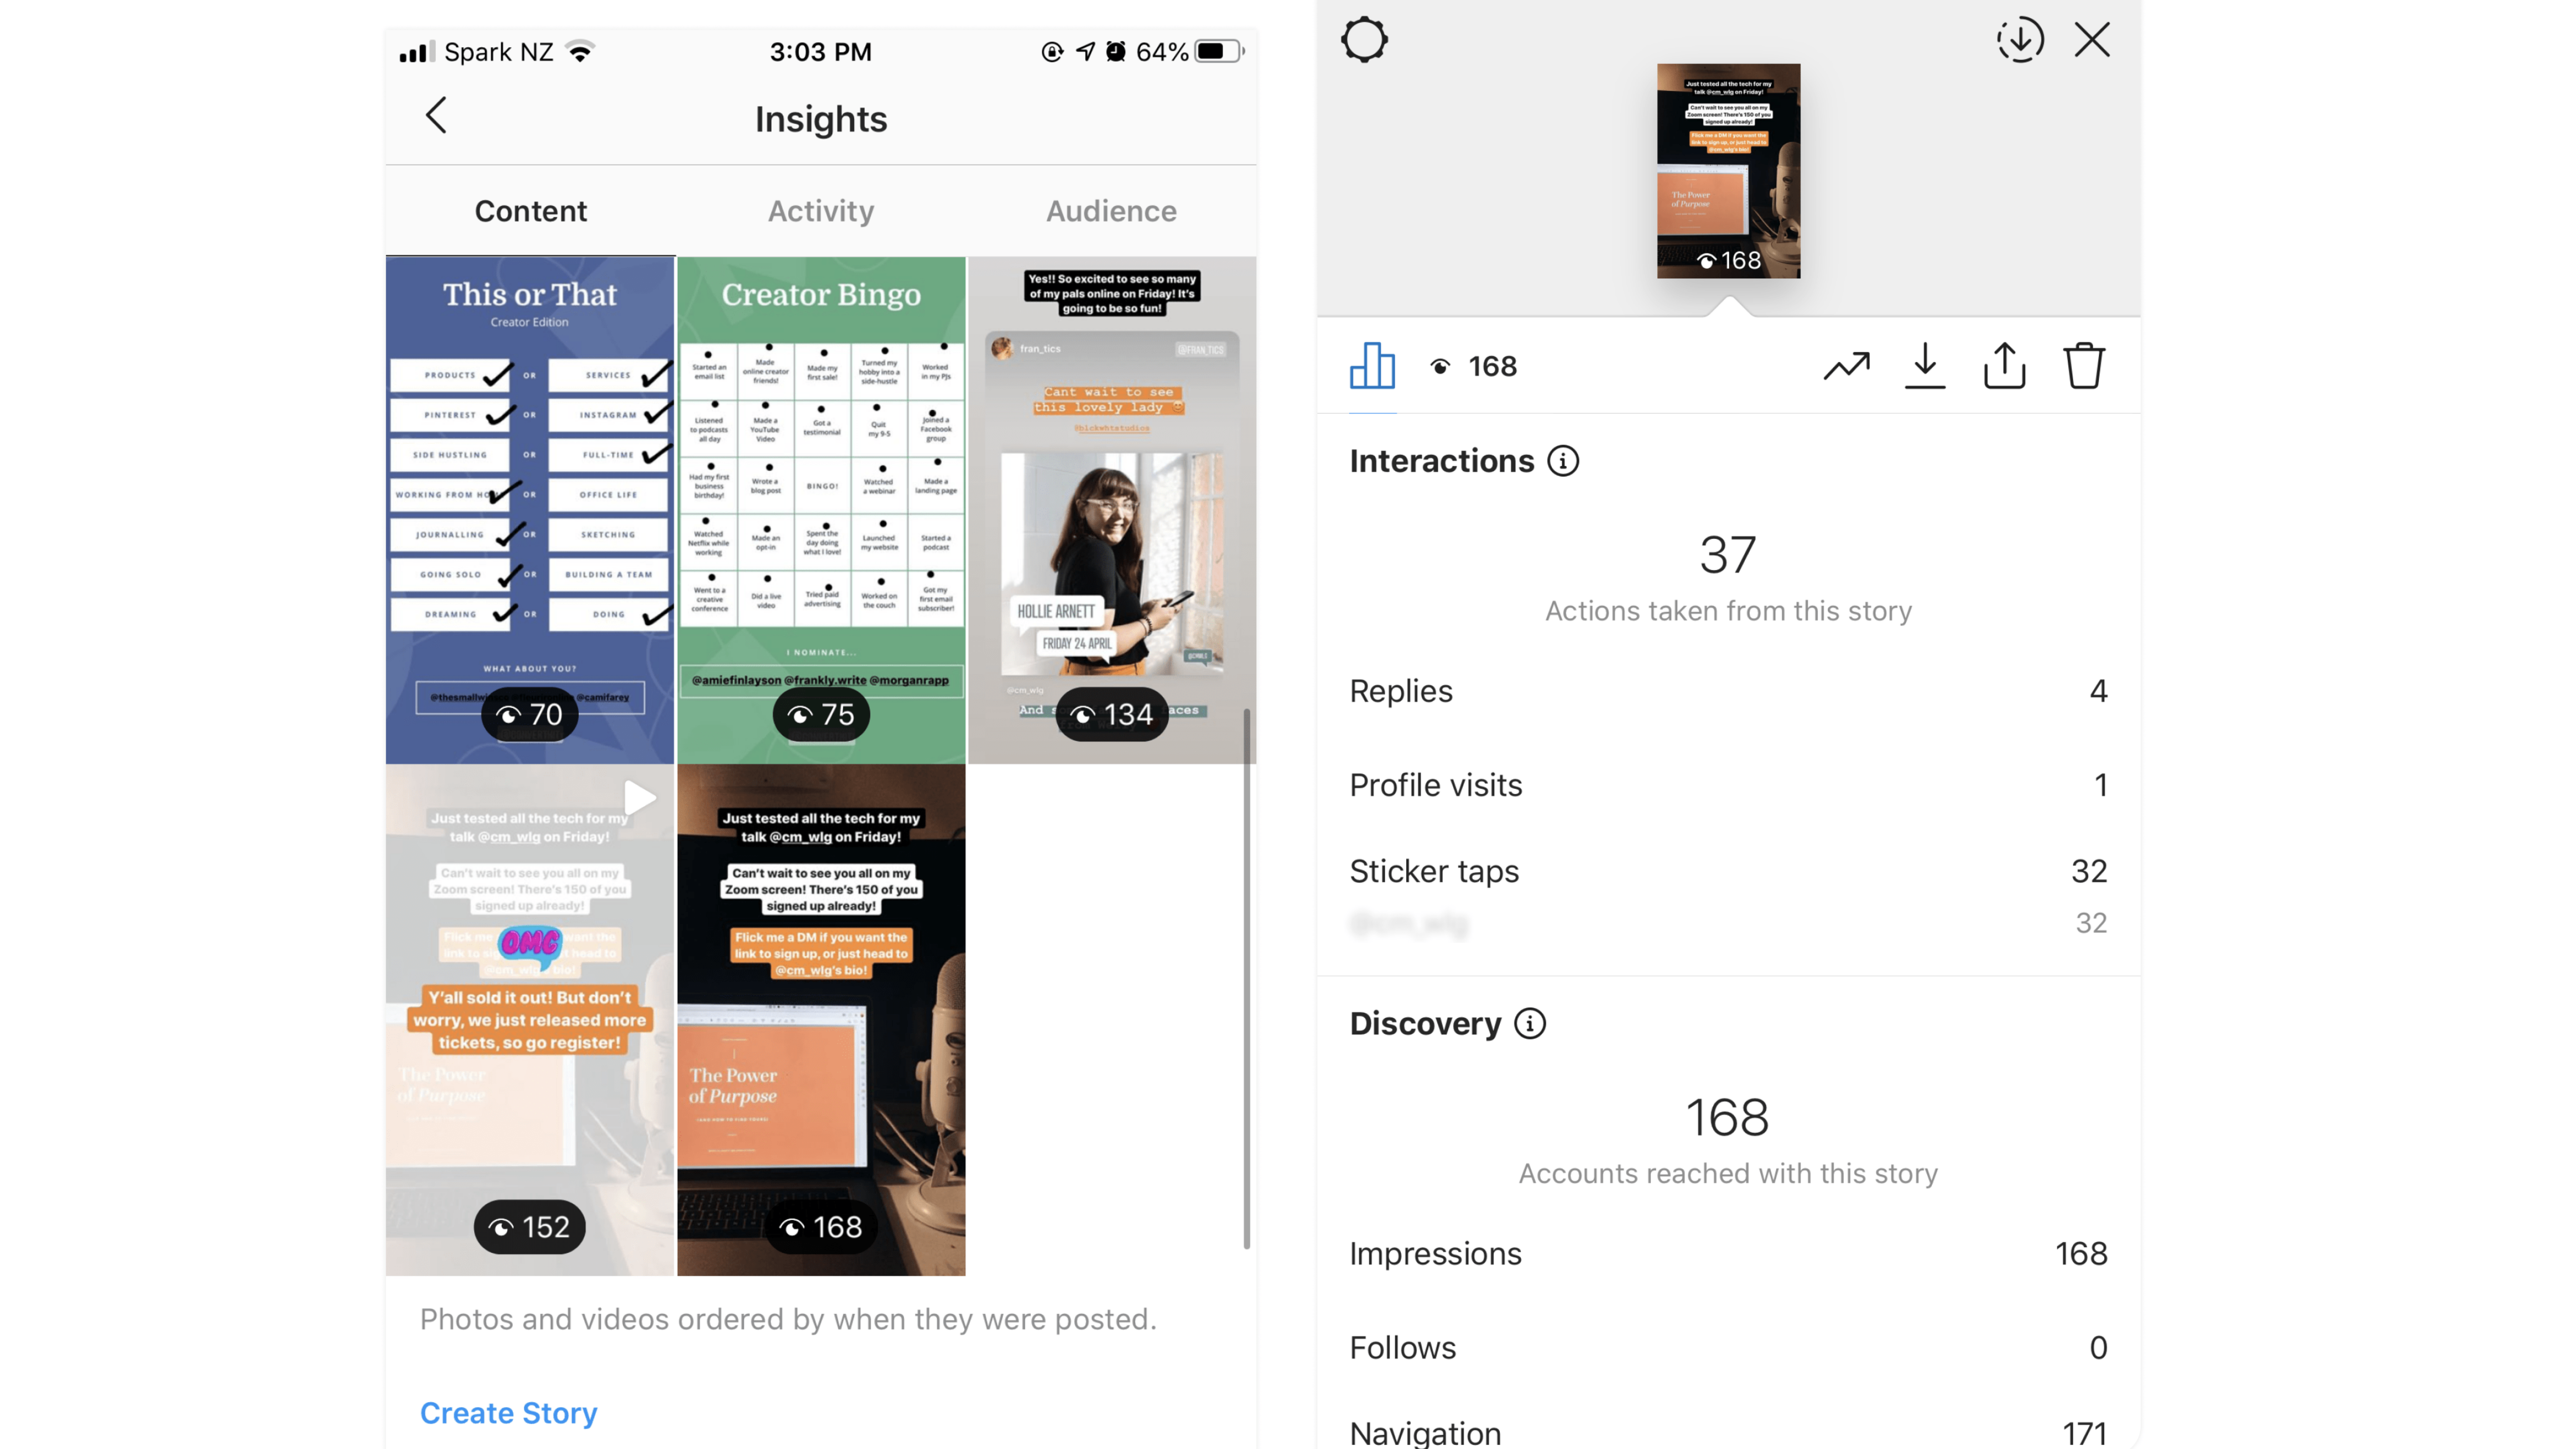
Source: ConvertKit
Quick Tip: Using these Instagram insights you can determine what type of content works best for you. Using the Navigation Insights, you can gauge your audience’s interest in your Stories. For instance, if you see a lot of Forward Clicks, you can easily conclude that the story wasn’t captivating enough.
Part 2: IGTV Analytics
Source: Bazaarvoice
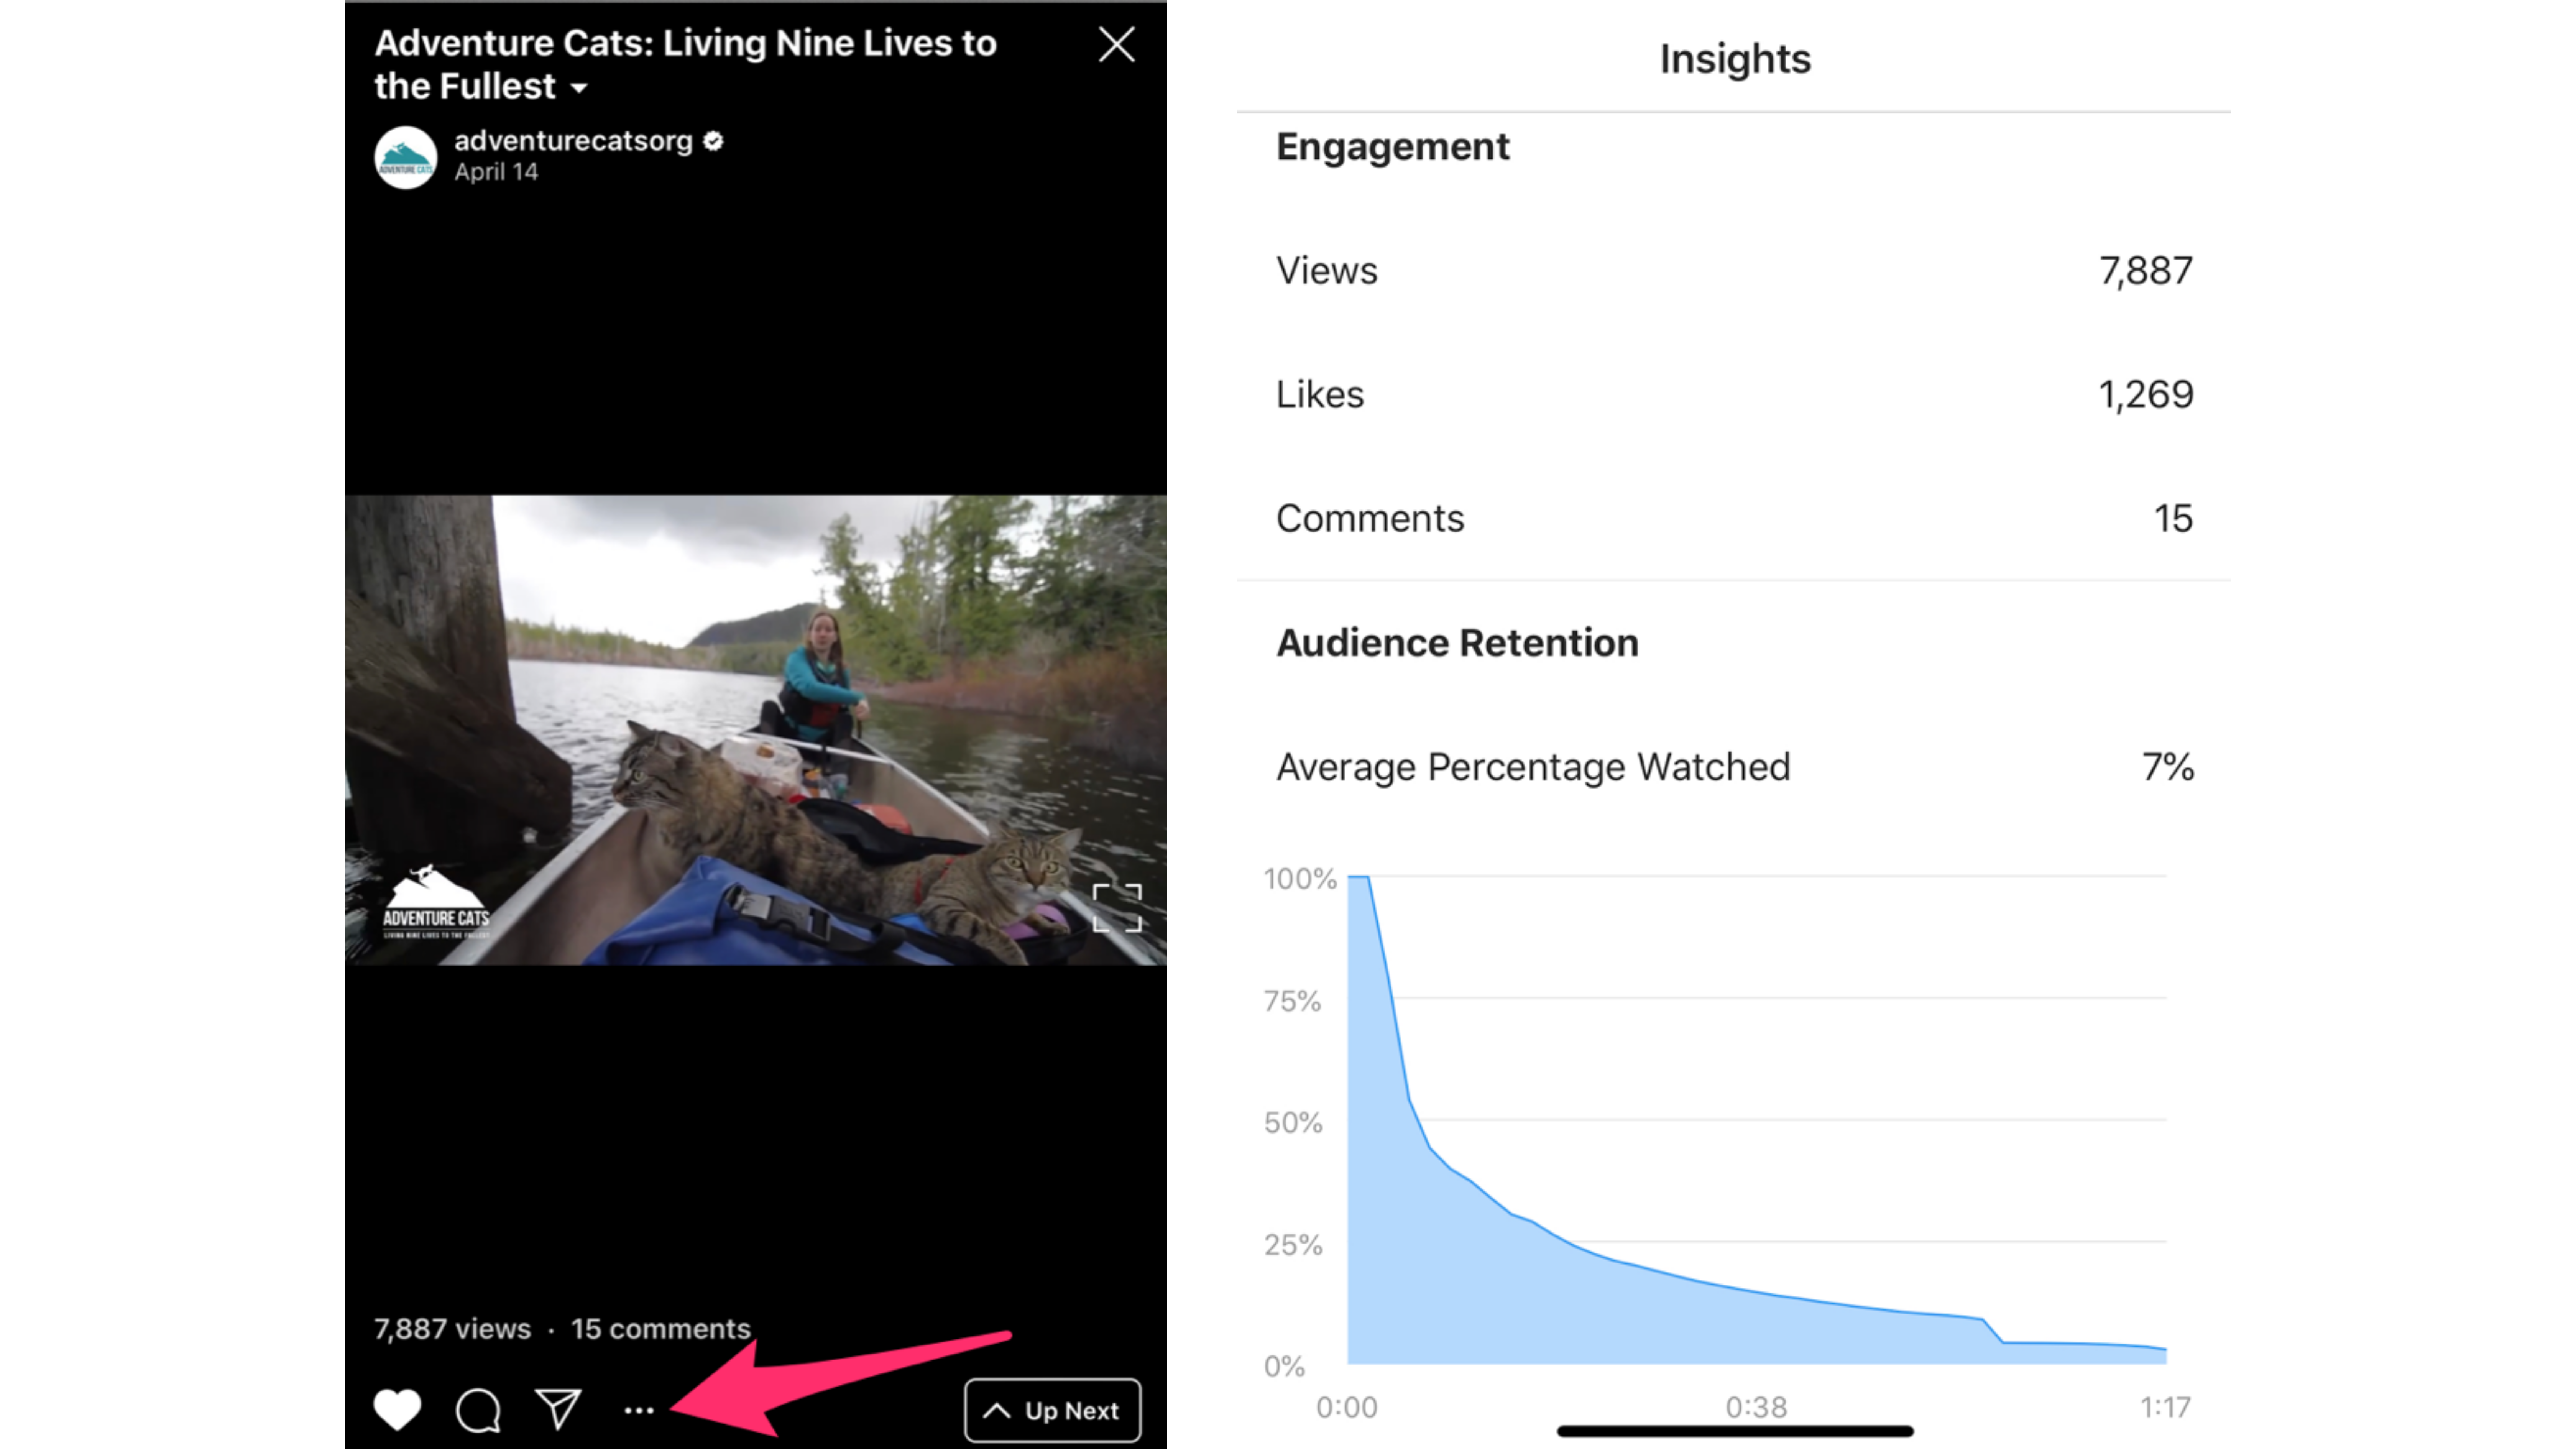
You can view the performance of up to 2 years’ worth of IGTV videos through Instagram’s Insights tab. Under “Content You Shared”, you’ll be able to view a number of insights such as:
- Comments
- Likes
- Reach
- Saves
- Video Views
- IGTV Video Interactions
- Average Percentage Watched (displays the point at which users quit watching)
Quick Tip: Understand what kind of content users are interested in by comparing Average Watched Percentage. Additionally, note what videos have the highest Reach and include this theme in your content strategy. Furthermore, you can check whether this video has gained reach through paid promotion only or through organic traffic.
Part 3: Instagram Shopping Analytics
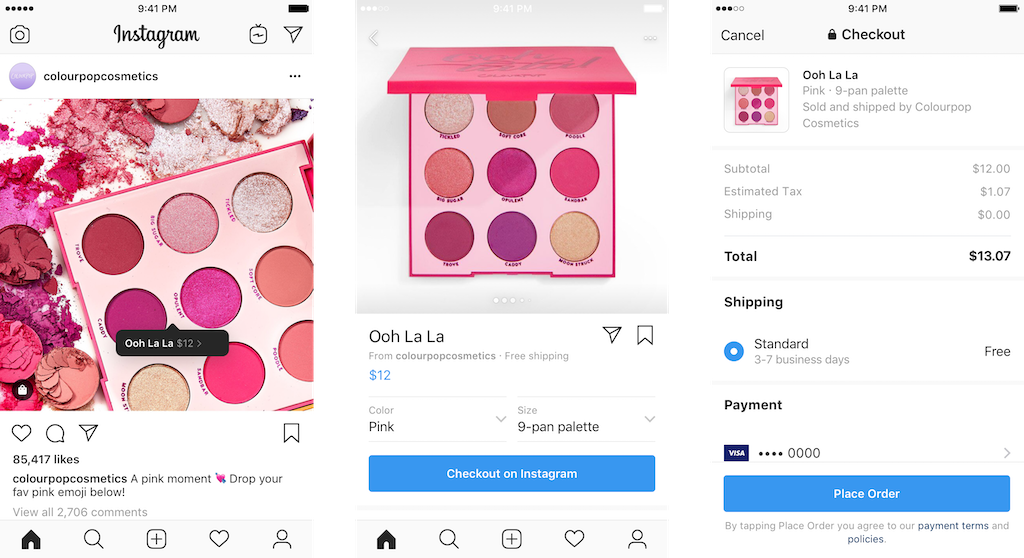
Source: Instagram
Instagram Shopping analytics is an excellent tool for businesses to learn which products are driving the most sales.
Head to the “Content You Shared” tab and you’ll be able to sort your stories by product-specific metrics if you have Instagram Checkout enabled. However, to see how individual posts are performing, tap “View Insights” to see extra shopping-specific metrics.
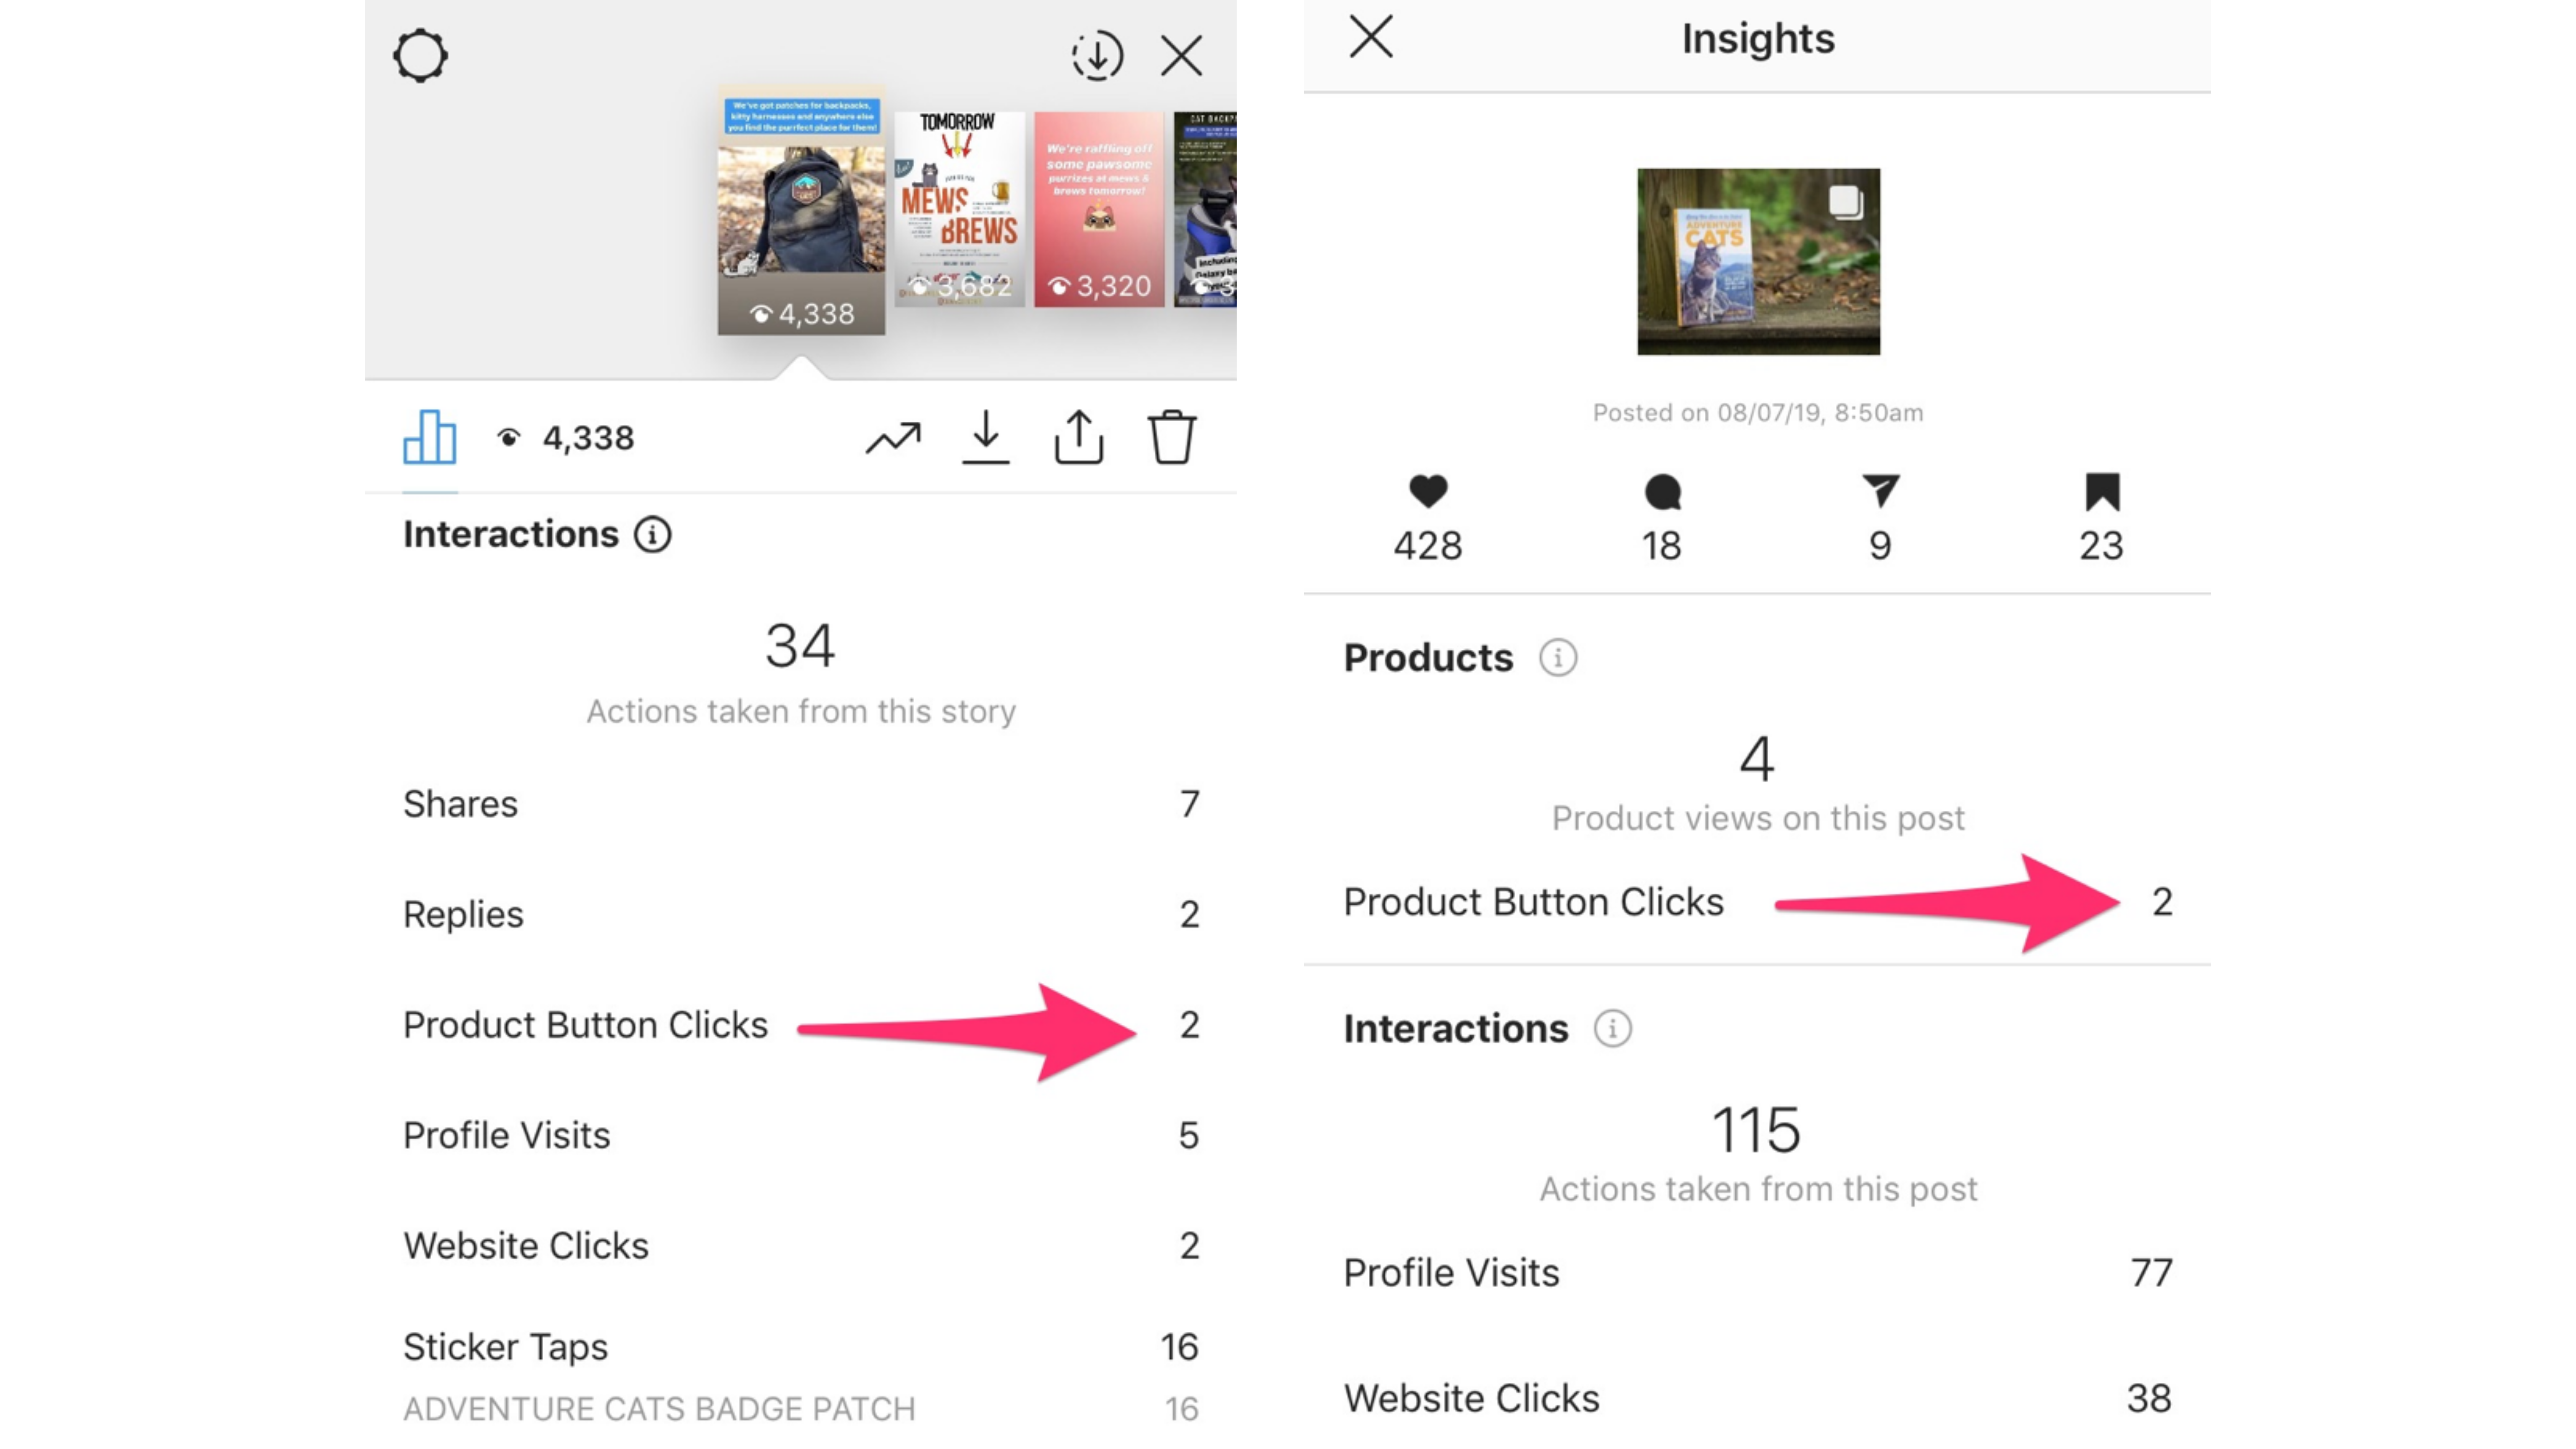
If you have tagged products on your posts or added product stickers on your stories, the two key metrics to note are:
- Product Views: The total number of times people tapped on the product tap to view the product page.
- Product Button Clicks: The total number of times people tapped on the purchase button on the product page.
Quick Tip: Are your product tags performing better in posts or stories? What’s getting your audience’s attention – the appealing product photo, certain aesthetics, imagery, or price points?
Part 4: Instagram Live Insights
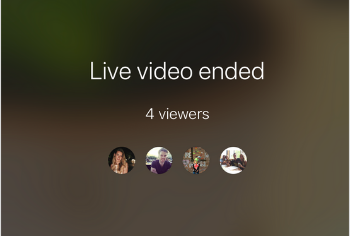
Source: Later
The only data currently available for Instagram Live is how many people attended your live broadcast. This data isn’t available through the Insights tab, so make sure to note down the count because once it’s gone, it’s gone forever!
Final Words
There is a multitude of Instagram insights that you can use but it’s best to have a clear view of your brand goals, and the key metrics that will help you achieve them. Remember to also play around with your tactics, experiment with your content, and see what drives your growth!

